How to Measure AI Search Visibility and Track SaaS Signups From AI Referrals
Track citations and referrals separately. Yes Rentals’ public case records AI citations rising from 47 to 319 and cited pages from 26 to 198 across 3 snapshots.
Measure AI brand mentions and citations with a fixed prompt set. Then track identifiable AI referrals, trial signups, and activation with a four-week plan.
An AI assistant can recommend your product in one answer and skip it the next time you ask the same question. Even a sustained rise in mentions leaves open two questions. Did more of the right buyers see your product, and did any of them come to your site and sign up? Answer those questions with two views. The first measures what assistants say across repeated samples. The second follows identifiable referrals through your own signup funnel.
Start with a buying decision
Pick one customer segment, market, and language. For an expense approval SaaS targeting midmarket UK finance teams, a useful question might be how to give department heads approval authority while preserving an audit trail. That gives you a clearer audience and a more useful content brief than a broad question like “What are the best finance tools?”
Pull questions from sales calls, support tickets, and on-site search. Group alternate phrasings by intent while retaining the original wording. Label each prompt with the buyer role, stage, market, and language. Use the product's actual capabilities to define which queries belong in scope.
| Buying stage | Example question | Page that can help |
|---|---|---|
| Discovery | Why do expenses pile up when several departments need to approve them? | Expense approval workflow guide |
| Evaluation | What should a midmarket UK team look for in expense approval software? | Features and scope page |
| Comparison | When does a finance team need two levels of approval? | Workflow comparison and product demo |
| Decision | Which expense tools let finance export an audit trail? | Export documentation with a trial entry point |
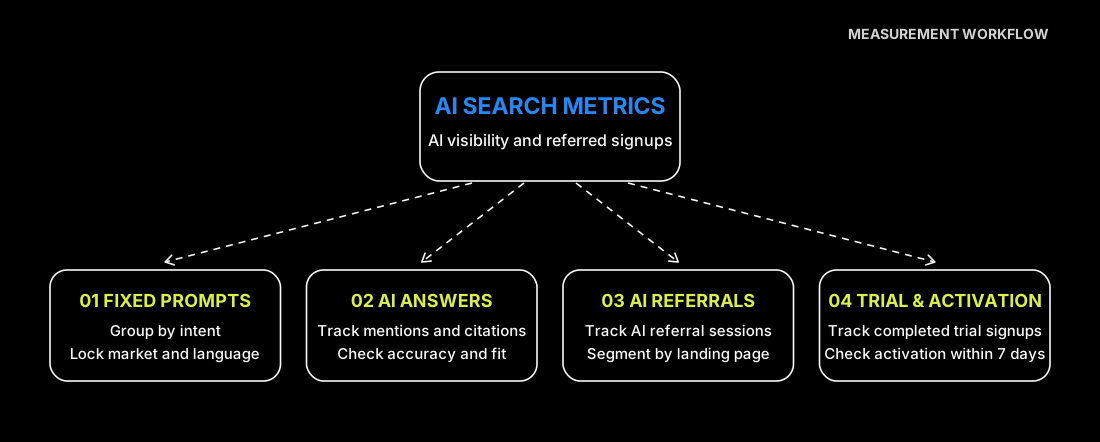
Freeze the prompt set and run it more than once
Start with 24 prompts across 2 platforms and 3 independent runs, for 144 planned responses per measurement round. Use six prompts per buying stage. Record the platform, visible model or mode, language, region, web search setting, and collection window. Start a new session for each prompt run and distribute the runs over the same number of days each time. If a platform changes its mode or interface, log the change so it can be considered alongside the trend. Research on repeated AI visibility measurements
Log failures, apply the same retry rule each round, and report completed versus planned samples. For a before-and-after comparison, use prompt, platform, and run cells with valid responses in both periods. Put newly added prompts in a separate group until they have their own baseline.
| Prompt ID | Stage | Platform and mode | Run | Brand mention | Site citation | Explicit recommendation | Evidence |
|---|---|---|---|---|---|---|---|
| UK-EVAL-01 | Evaluation | Platform A with web search | 1 | 1 | 0 | 1 | Saved response and source URLs |
Calculate each answer metric separately
In that case, mentions were 25 on July 17, 2026, 202 on August 16 and 198 on September 2. Citations were 47, 281 and 319 on the same dates. These are tool counts; the published snapshots do not give a valid-answer denominator for calculating a mention rate. Preserve the individual dates and metrics in the report.
Agree on brand aliases and owned domains up front. Resolve redirects and normalize URLs before counting citations. Count each eligible answer once per answer-level metric, even if it repeats a brand name or links to several owned pages.
| Metric | Calculation | What to investigate |
|---|---|---|
| Brand mention rate | Valid answers naming the brand divided by all valid answers | Which relevant buying questions rarely surface the product? |
| Owned-site citation rate | Valid answers linking to an owned page divided by all valid answers | Which product claims need a stronger source page? |
| Explicit recommendation rate | Valid answers explicitly recommending the product divided by all valid answers | Does the recommended use case match the intended buyer? |
| Product fact accuracy | Verified statements divided by all checkable product statements | Which features, prices, or limits are often described incorrectly? |
Suppose both rounds return 144 valid responses, and brand mentions move from 29 to 39. The mention rate goes from 20.1% to 27.1%. If owned-site citations move from 12 to 18, the citation rate goes from 8.3% to 12.5%. Before acting on either change, split it by platform and buying intent. Ten additional mentions concentrated in two prompts call for a different response than ten spread across several intents. Preserve the prompt grouping when interpreting uncertainty, since each prompt is sampled repeatedly.
Publish the facts buyers need to verify
Use the GEO checklist to review crawl access and the evidence on priority pages.
Create a lightweight product fact sheet. Give each fact an owner, a public source URL, a review date, and the conditions under which it applies. An audit export page should say which roles can export, which plans include it, what fields the file contains, and how long records are retained. A short example export helps a buyer verify the answer.
Put comparison information on a comparison page, setup steps in documentation, and plan limits on pricing. Link related pages to one another so buyers can move from evidence to a trial. Make core content easy to reach and read, and keep any structured data consistent with what the page actually says. Google Search guidance on AI features
Track referrals, trial signups, and activation
The Search Console versus Analytics guide explains which parts of the path each report can measure.
Use the session source and medium in your traffic acquisition report to identify AI referrals you can observe. Maintain a dated list of the source domains and grouping rules you use. Report landing pages and completed trials from the same sessions. To measure activation, follow the resulting trial cohort for a fixed period, such as seven days from signup to the first completed expense approval. Let the entire follow-up window close before comparing cohorts. GA4 traffic acquisition documentation
Keep identifiable referrals, branded search, and self-reported discovery in separate rows. Some users see an answer without clicking, use a different device, or arrive without a usable referrer. Leave those sessions unattributed unless a separate signal can be reported as such.
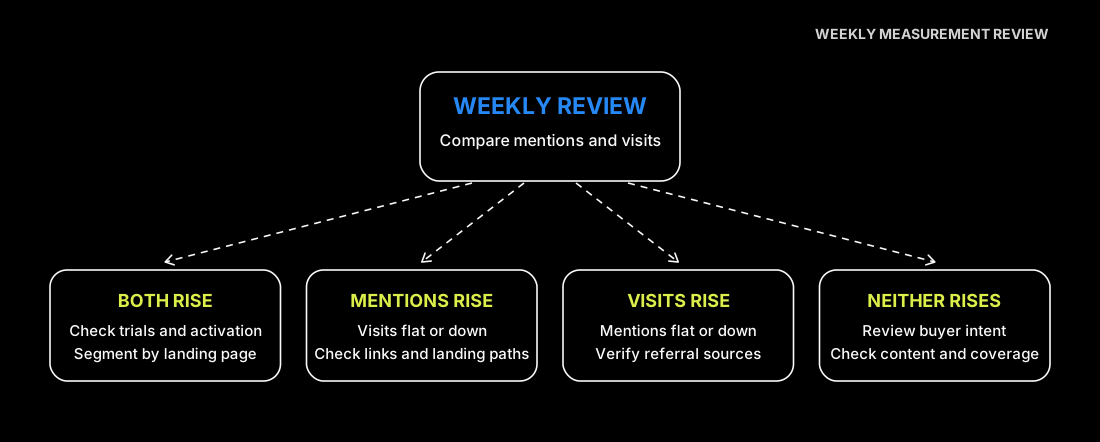
For example, suppose identifiable AI referral sessions rise from 63 to 78 and completed trial signups rise from 4 to 5. The observed same-session conversion rates are about 6.3% and 6.4%. Most of the change in trial count coincides with more recorded sessions. Both signup counts are small, and this comparison cannot establish the incremental impact of appearing in AI answers.
Run a four-week measurement cycle
- Week 1. Agree on the buyer, freeze the 24 prompts, verify product facts, and define the trial and activation events.
- Week 2. Collect the first sample. Have a second reviewer check ambiguous mentions and citations. Verify that key landing pages lead to a relevant trial.
- Week 3. Choose one comparison page and one evidence page with clear gaps. Log the exact changes, release dates, and other campaigns that run during the same window.
- Week 4. Rerun the original prompts. Review answer metrics and identifiable referrals side by side, then follow completed trial cohorts through activation.
For the next cycle, write down the change you observed, the evidence behind it, and one action to test. If comparison prompts cite your documentation more often but few readers start a trial, inspect the pages actually receiving visits. Add a relevant path to the product where it fits, then track what happens in the next cohort.